knabe
Well-known member
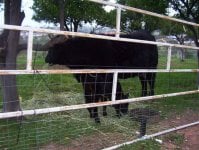
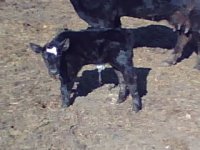
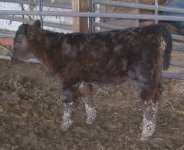
i don't have pictures yet, but had my first "planned" mating saturday out of my legacy plus/backdraft breeding PHAF cow. she's hetero T1, T3 and QG4. she was bred to toal package. had a solid black calf (absolutely no white), looks to be polled. he had a 13" cannon bone and a 124 lb birth weight with a slight pull to get the head through and out he came, no stiction with the hip, momma was tired after an hour. earlier in the day i was on an errand and my wife called and said it looked backwards with the feet pointing down. turns out it was just one foot resting over the other one. anyway, i called the vet and said to be prepared, got home, both feet up. she tried for an hour, so we pulled him. he nursed and is doing ok. doesn't look thick or special in any way.
last year she had her calf 6 days early, this year, one day. heifer calf last year was 99 lounds and popped out. this calf was homo for T1, T3, QG4 and hetero for T2. supposedly T2 is the rarest, and of the quality grade markers, QG3 the rarest followed by QG4, QG2, QG1. i think QG 1 increases IM fat by around 6.5% here's a cut and paste from
The TG5 thyroglobulin gene test for a marbling quantitative trait loci evaluated in. feedlot cattle. Aust. J. Exp. Agri. 44:669–674. notice this is from australia, and the bovigen genes are usually validated there first. notice specific comment about metabolic rate. slower metabolic rate seems to be inferred to have an effect on marbling. the difference appears to be how the genes are regulated, rather than a difference within the gene itself. initially, lots of studies trying to find the answers to things focused on changes within the genes. happily, that bias is not assumed any more and that's why people sequence gene's such as the hox genes across various organisms at different branch points in evolution, find difference, then go back to individual populations of one species and look for differences in those areas across say 96 or 384 individuals. i would love to do this with the PHA gene.
Minor genes can affect marbling, therefore its fatty acid composition. There is
evidence that at least five quantitative trait loci (QTL) are of moderate effects (Harper
and Pethick, 2004). Genes underlying two of these evident QTL are of most interest.
Barendse et al. (2004) found that polymorphisms near the thyroglobin gene (TG) on
chromosome 14 are associated with marbling capacity. The TG gene spans 300 kb of
DNA (Mercken et al., 1985) and encodes a protein that can indirectly play a significant
role in regulation of metabolic rate. The polymorphisms that are associated with
variation in marbling are not within the coding region of the TG gene, but lie within the
5’ untranslated region of the gene, which may be involved in regulation of gene activity
(Harper and Pethick, 2004). The second interesting QTL is on chromosome 5. The
closest marker is CSSM34, which is genetically close to the gene RARG (retinoic acid receptor gamma; Barendse, 1997). Again, the polymorphism associated with marbling is
likely to lie within the non-coding sequence of the RARG gene. The RARG gene
product is involved in regulation of transcription of a large family of genes. All-trans
retinoic acid, one compound of the retinoid family, binds to RARG, which, in turn, binds
to specific sequences of the DNA in the nucleus. Retinoic acid receptor gamma binding
results in an increase in the rate of transcription from the gene to which it bound. The
retinoic acid receptors and the retinoid-binding receptors are important regulators of
normal development of organs and tissues (Solomin et al., 1998). Although the detailed
mechanism is not discovered, the relationship between low vitamin A status and high
marbling score might lead to some possible explanation (Oka et al., 1998; Naruse et al.,
1994; Kruk et al., 2004; D’Souza et al., 2003).


")


![Gradys_(372)1[1].jpg](/data/attachments/2/2096-f3a96cf04fc64c502cc320a19c19b8ec.jpg)